
20
2023
-
07
Recycling of Heterogeneous Mixed Waste Polymers through Reactive Mixing (2)
Keywords:
mixer,heterogeneous blend,recycling
Source: internal company
3. Results and Discussion
3.1. Blends Characterization
For all the mixtures, the mixing time was 5 min, the lowest time at which all the heterogeneous mixtures reached a steady state value. This means that all the mixtures reached in these mixing conditions have a thermo-flow-dynamic equilibrium. MFI values of all the blends mixed for 5 min at all the mixing conditions are reported in Table 6.
Table 6. MFI values of all the investigated blends.
| Property | A3 | B3 | C3 | C2 | D3 | D2 | D1 |
| MFI, g/10 min | 0.503 | 0.537 | 0.542 | 0.568 | 0.571 | 0.597 | 0.689 |
It can be seen that the MFI value decreases as the temperature decreases and the mixing speed increases. Of course, by increasing the mixing speed, the melt is subjected to higher shear mechanical stress. For example, the D1 blend, obtained at 60 rpm, shows an MFI of 0.689 while the D3 blend, mixed at 250 rpm, shows an MFI of 0.571. A significant difference in the MFI values was also observed by changing the processing temperature. Indeed, the value of the MFI of A3, mixed at 180 °C, decreased by about 12% with respect to the blend A3 mixed at the same rotational speed, but at 270 °C.
Figure 2 shows the complex viscosity curves, η*, as a function of the frequency. For the sake of simplicity, only the viscosity curves of A3, C2 and D1 blends are shown.
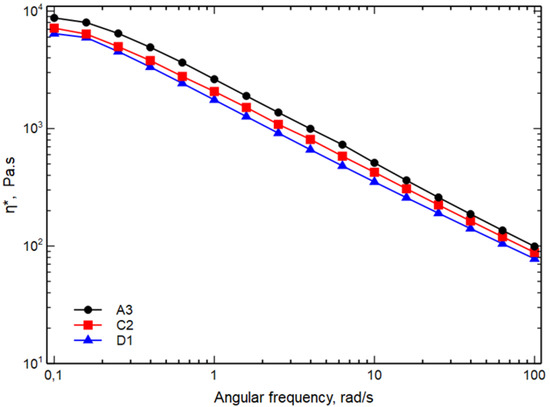 Figure 2. Complex viscosity as function of the frequency of the samples A3, C2 and D1.
As expected, from the results of MFI, it can be seen that, as the temperature decreases and the mixing speed increases, an increase in viscosity is observed both at low frequencies and at high frequencies. The viscosity of the blends depends on the viscosity of the components but also on the size of the dispersed phases and on the adhesion among the phases. In particular, the viscosity of the blends increases with decreasing the size of the particles of the dispersed phases and improving the adhesion among the phases. It is, then, possible to hypothesize that sample A3 could have dispersed phases particles with lower dimensions and/or a better adhesion between the continuous and dispersed phases.
The micrographs of the same blends reported in Figure 2 are shown in Figure 3 at two different magnifications. Sample D1 can be considered as the reference sample because it is the only blend processed at 270 °C with all the components in a molten state similar to all the conventional melt processing operations. The micrographs clearly indicate the strong incompatibility between the polyethylene matrix and the other dispersed polymers. Indeed, this blend shows the typical morphology of heterogeneous incompatible blends. The dispersed particles are quite big, show a broad range of dimensions and many large voids are observed in the continuous phase, indicating a very scarce adhesion between matrix and dispersed phases. By decreasing the temperature and increasing the stress of samples C2 and A3, however, the size of the dispersed particles decreases suggesting a better mixing and, moreover, smaller voids seem to suggest a slightly better adhesion.
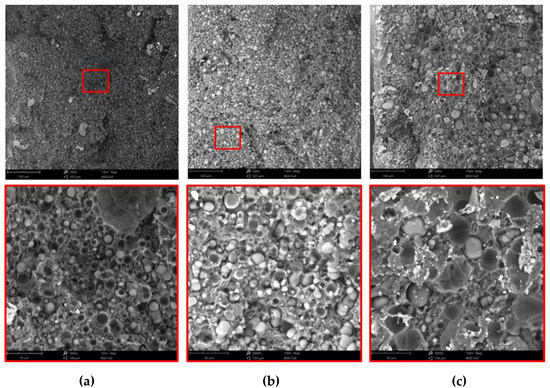 Figure 3. SEM micrographs: (a) A3, (b) C2 and (c) D1.
In Figure 4 the particle diameter distribution for the three samples is reported. Statistical functions were used to describe the distribution of particles. In particular, the normal distribution was used. The curves shown in the figure confirm the qualitative observations made on the micrographs.
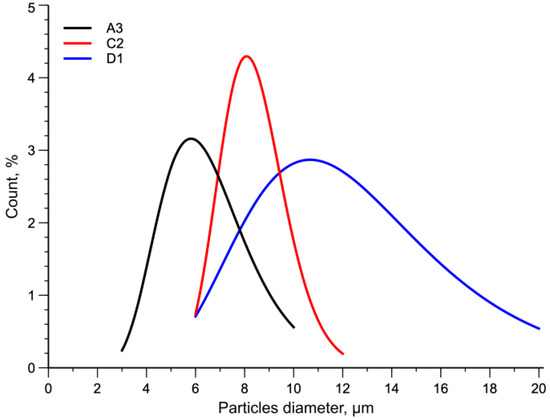
Figure 4. Normal distribution curves of particles diameter.
Lower temperatures and higher rotational speeds give rise to higher shear stress acting on the melt. These processing conditions strongly determine the size of the dispersed particles and their distribution. Indeed, by decreasing the temperature from 270 °C to 180 °C and increasing the rotational speed, samples A3 and D1, the numerical average diameters are 6.5 µm and 12.6 µm, with the distribution ranges going from 3–10 µm to 6–20 µm, respectively (see Table 7).
Table 7. Numerical average diameter values of A3, C2 and D1 blends.
| A3 | C2 | D1 | |
| Numerical average diameter, Dn, µm | 6.57 | 8.34 | 12.66 |
In agreement with our previous works, the contact area between matrix and dispersed particles was calculated by considering the surface area of each particle by the number of particles. In more detail, the contact area of each particle is proportional to its square diameter, as follows

and the number of particles is as follows:

where Vti is the total volume in the sample and Vi is the volume of each individual particle present. The total contact area of each sample is then as follows:

The ratio between the contact area of A3 e C2 with respect to D1 is as follows

where 𝐀𝐀3𝐭, 𝐀𝐂2𝐭 and 𝐀𝐃1𝐭 are the total contact and are of the sample A3, C2 and D1, respectively. In Table 8 the values of the total contact area with respect to D1 are reported.
Table 8. Total contact area value with respect to D1.
| A3 | C2 | |
| Total contact area with respect to D1 | 1.926 | 1.517 |
Based on the average equivalent diameter reported above, it is observed that the total contact area increasing with decreasing temperature and increasing rotational speed. By increases the contact area and decreasing the particles diameter the transmission of the stress is improved giving rise to better properties of the blend.
In Table 9 the values of the torque registered after 5 min for the same samples are reported.
Table 9. Torque values at 5 min for the blends A3, C2, D1.
| Property | A3 | C2 | D1 |
| Torque, N m | 32.2 ± 1.4 | 24.8 ± 1.1 | 15.5 ± 0.9 |
The torque, directly proportional to the shear mechanical stress acting on the melt, can be considered as the unique experimental processing parameter that determines the final morphology of the blend because the torque increases with increasing the mixing speed and decreasing the temperature. Higher shear stresses are able to break the particles of the dispersed phases giving rise to smaller particles and then to a decrease in the particle diameter and to an increase in the contact area between the matrix and the other phases. Moreover, it is possible to hypothesize that the very high shar stress breaks the macromolecular chains giving rise to macroradicals. The macroradicals of different polymers can react forming copolymers that can act as compatibilizers or as adhesion promoters between the matrix and other phases, improving, then the adhesion between the various polymers with the matrix.
Table 10 summarizes the values of elastic modulus, E, tensile strength, TS and elongation at break, EB, of all the blends analyzed, while, in Figure 5, for the sake of simplicity, the typical stress-strain curves of the blend A3, C2 and D1 are shown. In this Figure, the sudden change of the stress-strain curves is due to the change in the crosshead speed.
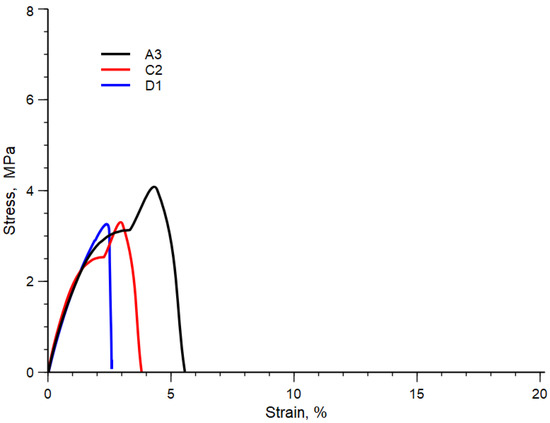
Figure 5. Stress-strain curve of A3, C2 and D1 blends.
Table 10. Elastic modulus, E, tensile strength, TS, and elongation at break, EB, of all the investigated blends.
| Blend Code | E, MPa | TS, MPa | EB, % |
| A3 | 176 ± 19 | 4.2 ± 2.5 | 5.1 ± 1.1 |
| B3 | 172 ± 23 | 3.5 ± 1.8 | 3.3 ± 0.8 |
| C3 | 174 ± 18 | 3.8 ± 1.5 | 3.2 ± 1.0 |
| C2 | 169 ± 23 | 3.5 ± 1.5 | 3.1 ± 0.9 |
| D3 | 181 ± 27 | 3.9 ± 1.6 | 3.0 ± 0.7 |
| D2 | 171 ± 24 | 3.5 ± 1.6 | 2.8 ± 0.6 |
| D1 | 165 ± 22 | 3.0 ± 1.9 | 2.6 ± 0.5 |
As expected, due to the strong heterogeneous nature of these blends, all the samples are brittle, see Figure 5, and present low mechanical properties (see Table 9). However, all the mechanical properties slightly improve with decreasing the temperature and with increasing the rotational speed. This behavior can be ascribed to both the decrease in the diameter and then to an increase in the contact area and/or to the same improvement in the adhesion due to the formation of copolymers.
The elongation at break is the mechanical property more sensible to the molecular structure and to the morphology. Then, the improved elongation at the break of the A3 blend can be attributed to the better morphology obtained at the lower temperature and higher mechanical stress. On the contrary, the worst value of elongation at the break is observed for sample D1 prepared at the highest temperature and lowest rotational speed.
Figure 6 shows the FTIR spectra of the A3 and D1 blends and the individual polymers in the blend.
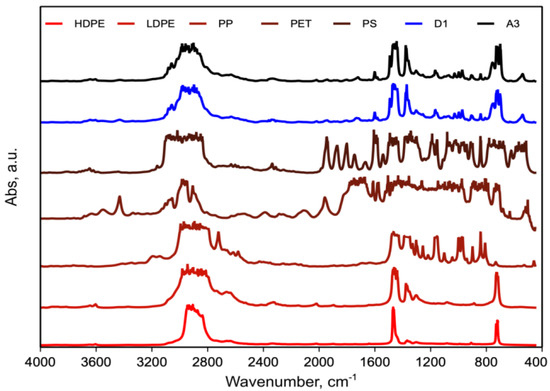 Figure 6. FTIR spectra of A3, D1 blend and individual polymers in blend: PE (HD and LD), PP, PET and PS.
The comparison of the FTIR spectra of pure PEs (HD and LD), PP, PET and PS with those of the blends D1 and A3 revealed that no new peaks or significant shifts of peaks were observed. However, it is not possible to ascertain if this is due to the lack of formation of copolymer or is due to instrumental limits because of the very small amount of undetectable copolymers.
Related news
Email:info@lykzhb.cn sales@lykzhb.cn
Tel: +86-379-65195189 Fax:+86-379-65182189
Technology Service:+86-13838843223
Add:Unit 1-501/502, Area B, Luoyang National University Science Park
Factory Add:Weier Road, Luoxin Industrial Zone
A high-tech enterprise integrating technical consulting, product development and manufacturing, technical services and project operation

©2023 Luoyang Kaizheng Environmental Protection Processing Equipment Co., Ltd www.300.cn SEO This website supports IPV6